![[Home]](http://meatballwiki.org/meatball.gif) TextVisualization
TextVisualization
MeatballWiki | RecentChanges | Random Page | Indices | Categories- A picture is worth a thousand words.
Introduction
There is a crisis of a sort within the field of literary criticism. While technology continues to improve, many within the field remain sceptical that computers can be used for real literary criticism (Ramsay, 2003; Rockwell, 2003; Sinclair, 2003). After all, meaning remains the domain of humans. And yet at a more pragmatic level, we need computers to help us keep pace with the staggering amount of information. As many argue (Bradley and Rockwell, 1994; Wise, Thomas, Pennock, Lantrip, Pottier, Schur, et al., 1995; Lan Ramsay, 2003; Rockwell, 2003; Sinclar, 2003), applying scientific visualization techniques to text corpora is the way forward. How then can we reconcile this with the history of literary criticism?
A brief history of visual text
Humans have used pictures for thousands of years, to convey meaning. We have been drawing on cave walls, making marks, placing stones, and otherwise building representations in the world for the benefit of other people. Yet, this was the exception. Humankind was for the most part an oral culture, transmitting information by sound, person to person. Writing changed this forever in ways that paintings could not. As Ong (1982) tells us, writing was the first codified system of markings where the writer could exactly determine what words were generated in the mind of the reader. In this way, writing allowed us to convey our thoughts in fixed, external, visual form. It takes words from the sound world into a visual, visible one. But visualizing our thoughts was not without its detractors. Plato (as qtd. in Ong, 1982) argues in Phaedrus and the Seventh Letter against writing that it is inhuman to externalize what is in the mind.
Early writing did not resemble writing today. As Ong (1982) describes, manuscript culture remained mostly an oral culture. Writing materials were expensive, and those skilled in writing were few. Thus, written language was limited to manuscripts, and manuscripts were few. Copying text from one manuscript to another was a highly idiosyncratic process, making no two manuscripts the same. Further, words were often abbreviated to favour the copyist, and the spaces between words were squeezed to save on expensive writing materials, making manuscripts difficult to read visually. Writing served only to store and then retransmit information back into the oral world. Thus people only read aloud, not only in groups as they often did, but even when reading to themselves. Readers memorized manuscripts because they were too difficult to use as reliable resources. It is not surprising then that culture gave priority to the aural/oral. As Ambrose of Milan wrote in his Commentary on Luke (iv. 5 as qtd. in Ong, 1982), "Sight is often deceived, hearing serves as guarantee." Its vestiges remain today, as we speak of auditing, that is, hearing account books.
Only with the advent of the printing press did language become visual in the sense with which we are familiar. Although writing had made fixed and visible our words, print made them a structured, legible, and common experience. While each manuscript was unique, each venerated for itself, the mass production of the printing press made books commodities in a market (Schement & Curtis, 1995). Market pressure weighed the many consuming readers more highly than the single author, as a small improvement by the author could improve thousands of copies, and so print became focused on ease of consumption. Printed texts are far more legibile than manuscript texts; and as Ong (1982) tells us the greater legibility of course ultimately made for rapid, silent reading.
Greater proliferation of cheaper books created a literate culture demanding more books (Schement & Curtis, 1995). It became preferable to refer to books rather than memorize them. While early printed books had typography and layout that would look strange to us today, or perhaps just Dadaist (Gale, 1997), they quickly dropped their manuscript roots and learnt how to use the medium effectively. First, beginning with Gutenberg's 42 line Bible, the individual characters on the page gained a spatial structure, often gridlike. This led to changes in poetic style, as poets began fixing the visual forms structure of their poems, most extremely demonstrated by e.e. cummings's concrete poem r-p-o-p-h-e-s-s-a-g-r ("grasshopper"). This also meant that page numbers were equivalent from copy to copy, which gave rise to labelling and indexes. While, as Ong writes, oral rhetoric did have loci to organize arguments which functioned similar to headings, these were thought to be places in the mind where ideas were stored. Now, the printed word itself could be spatially--''visually'--organized, into paragraphs, pages, sections, and chapters.
Further, print created a culture of technical diagrams that could not exist before in manuscript culture, as so humourously parodied by the feckless monk's illumination of a simple blueprint in A Canticle for Leibowitz (Miller, 1959). Scribes, often copying without awareness of context or meaning, would imperfectly hand copy a diagram from one manuscript to another, as Ong (1982) gives the example of a clover turning into an asparagus. Precise reproductions, however, became possible with print. While illuminations were of course common with manuscripts, they were of course illuminations--added by the copier onto the text. With print, diagrams become part of the text itself. Thus, it was not surprising that Giambattista Vico placed on the frontispiece of his Scienza Nuova (The New Science) an allegorical diagram representing what constituted the new science (See Appendix I, Figure 1). And not only were the icons in the image important, but their spatial relationship mattered. Metaphysics is standing on a globe representing the world of nature, and objects representing the civil world are arranged in a line at the bottom (Bradley and Rockwell, 1994).
In short, text has long since employed a visual structure to give it meaning, and thus really began what is text visualization today.
Text analysis
Text visualization as we mean it, today, however is not about typography, layout, and figurative diagrams. Text visualization is about representing the underlying mathematical structure of a text or a group of texts. That being said, it is not obvious how texts have an underlying mathematical structure. There are three main types of mathematical structures considered, in decreasing order of prevalence (Wise, Thomas, Pennock, Lantrip, Pottier, Schur, et al., 1995):
- First-order statistics. Basic on word counts, such as word frequencies, concordances.
- Second-order statistics. Clustering algorithms to identify related documents or word patterns.
- Third-order statistics. Identify semantics through natural language understanding algorithms.
Grouping them together, we call this the subfield of literary criticism "text analysis". Text analysis began in the 13th century through the practice of finding new intratextual meaning from the Bible (Rockwell, 2003). For the most part, this took the form of the first-order statistic concordance, which is finding all the contexts of a word's use throughout a text. Early on this was a painstakingly manual process, often taking decades. In the 20th century, the rapid development of computation has made it possible to analyze an entire text automatically in a fraction of the time it would take to do manually, and with less errors. Starting in the 1960s, text concordance software began being used seriously in literary criticism. Finally, in the 1980s, software like TACT (Lancashire, Bradley, McCarty, Stairs, and Wooldridge, 1996) became available for personal computers, allowing the literary researcher to perform statistical analysis at home at her leisure.
After being inspired by an initial serendipitous finding (Bradley and Rockwell, 1996) by visualizing concordances in Hume's Dialogues (See Appendix I, Figure 2), Bradley and Rockwell (1994) argue that scientific visualization can greatly benefit text analysis, especially since text analysis has matured enough to have standard techniques and common data structures to plug into scientific visualizations. As they later again argue "Reading tables of numbers to find patterns becomes difficult after a certain point. Scientists have therefore resorted to visualization tools to help them discover anomalies and find patterns in quantitative data. In the humanities we are in an analogous situation. The quantity of electronic texts and the amount of quantitative data we can gather about these texts is overwhelming our ability to interpret the results. For this reason we need to explore interactive visualization tools appropriate to our data." (Rockwell, Bradley, and Monger, 1998)
As Wise, et al. (1995) argue, visualization would benefit any reader whose "rather slow serial process of mentally encoding a text document is the motivation for providing a way for them to instead use their primarily preattentive, parallel processing powers of visual perception. The goal of text visualization, then, is to spatially transform text information into a new visual representation that reveals thematic patterns and relationships between documents in a manner similar if not identical to the way the natural world is perceived," since as Ware (2000) describes in significant detail, the human visual system has evolved for wholly different tasks than reading. Indeed, as Wise (1999) later argued, it's necessary to design text visualizations from the human eye down, rather than from the text analysis up.
That is easier said than done. While much scientific data is inherently spatial such as atmosphereic temperature samples, (free-form) text is abstract and non-spatial. Therefore, visualizing the non-visual requires mapping the abstract to the physical (Rohrer, Ebert, Sibert, 1998), but any such mapping is arbitrary and thus possibly meaningless, or least only having a meaning separated from the source text. Indeed, the output of any text analysis is essentially a new text. Much debate has been made about whether these constitute a new text (Ramsay, 2003, Rockwell, 2003, Sinclair, 2003). It's difficult for many to accept visualizations as valid arbiters of textual meaning; they'd rather give priority to humanistic impression or even well-heeled techniques like concordances. Nonetheless, Rockwell (2003) makes the common sense claim that text analysis and text visualization are merely interpretative aids, secondary and dependent to the primary source text:
- There is no a priori privilege to certain processes of decomposition and recomposition such as traditional concording. The assumptions behind concording are as suspect as those behind newer visualization techniques, despite the long tradition of using concordances. Familiarity with concordances should not breed contempt for techniques that produce unusual results such as visualizations. (Rockwell, 2003; p. 5)
Information overload
Internal arguments within the literary criticism profession about the validity of text analysis often seem like they are missing the point; or rather, an attempt by an older generation to hold onto the vestiges of a dead paradigm. In our contemporary society, it's a cliché to talk about information overload. Many professionals have to process an immense amount of information every day. To that end, many in other industries are just moving forward with text visualization despite any philosophical doubts others may have.
One such effort was the Virtual Shakespeare project at IBM (Small, 1996). They visualize the full million line Shakespeare corpus using a three dimensional interface. In this interface, they simply present the entire text on a flat plane. As Raskin (2000) argues, the ability to smoothly zoom in and out from the text allows the reader to gain wider context (at the expense of detail). So, for instance, by highlighting one character's text throughout a play, a zoomed out reader can see at a glance how often that character appears in the play in relation to the rest of the text (See Appendix I, Figure 3). Also, annotations can be presented in context by simply rotating them 90 degrees to the plane of the text rather than forcing the reader to move away from the text (See Appendix I, Figure 4).
While Small (1996) was primarily concerned with typography in 3D space, others have a much more serious goal. The Pacific Northwest Laboratory (PNL) in the United States were tasked by the intelligence community to simplify the stunning amount of news they have to keep up with every day. They have made a number of interesting visualizations.
One subfield of text visualization that has had a lot of investigation is topic clustering. Many approaches have been tried. Most rely on the Kohonen self-organizing clustering algorithm (Kohonen, 1989), such as Lin (1997), and thus mostly they focus on representing the information in novel ways. However, these representations assume a static text corpus. As Wise, et al. (1995) argue, no text visualization should assume a static text, but rather be able to smoothly incorporate new documents as they are created or discovered. PNL came up with the novel ThemeRiver (Havre, Hetzler, Whitney, and Nowell, 2002) to elegantly demonstrate how topic focus in daily news changes over time to fit changing circumstances (See Appendix I, Figure 5). Rather than cluster the entire set of documents, they cluster them by time, and then show how the time frames connect. This is wholly different from traditional text analysis.
As the Topic Islands group at PNL write, however, most text visualization is "primarily concerned with the general characterization of the corpus, enabling the user to rapidly focus on a subset of potentially interesting documents. Ultimately, however, the user must endure the often tedious effort of reading the identified documents. This can be especially cumbersome for lengthy documents. Quick ways that adapt to the amount of detail the user is willing to accept are needed." (Miller, Wong, Brewster, and Foote, 1998; p. ?) Using a novel statistical process called wavelet analysis, they identified theme shifts within the text of a single document which they then topic cluster in stunning--and accurate--visualizations (See Appendix I, Figure 6).
One failing of Topic Islands is that it still requires a human operator, even though it appears possible for a computer to eventually fully automate the process. Liu, Selker, and Liberman (2003) have used the Open Mind Commonsense database of 400 000 facts to automatically detect the emotional timbre of each sentence within a text and then visualize it, thus automatically showing the affective tone and mood of the text. Equally as impressive is WordsEye (Coyne and Sproat, 2001) that automatically creates figurative 3D visualizations of English description of scenes (See Appendex I, Figure 7).
These qualify as the third-order statistic, a semantic algorithm. For those holding onto concordances, they are missing out on developments such as these. While they may argue that a human could more effectively code a text for mood and tone, it is cost prohibitive to do this for the sheer volume of text we must deal with daily.
Further, the more we create what Aarseth (1997) calls ergodic text, the more it will be necessary to use computational statistics simply to read it, simply because these texts are themselves combinatoric and stochastic. For instance, Raymond Queneau's Cent Milliards de Poèmes allows one to interchange the lines of ten separate sonnets; according to Queneau, a person reading the book 24 hours a day would require 190 258 751 years to finish (Mathews & Brotchie, 1998 [as qtd. in Ramsay, 2003]) While that may be a poem, for corpuses like daily world news, reading simply becomes statistical.
Reading habits
Reading habits ought to change with visualized text. They don't necessarily have to change for the better. As Hornbæk and Frøkjær (2003) discovered, techniques like zooming in and out reduce the readability and retention of large texts.
Nonetheless, there can be improvements. Much as print editors improved readability by adding headings for their readers, Topic Islands detects where those headings should be and inserts them for you. For the harrowed reader, this can greatly facilitate tmesis (Aarseth, 1997). Further, can visualize semantic structures as Liu, Selker, and Liberman (2003) demonstrate, which can greatly simplify narratives; as a result they demonstrated a roughly 30% faster time to answer plot-based questions.
The question for literary critics remains, however, how will text visualization change their readership? Ramsay (2003) argues that text analysis misses the point by talking solely of scientific inquiry and hypothesis testing. Rather he suggests the software can tamper with the text to create new reading experiences. "Instead of concording nouns in a text, we might create machines that cleave off all words except the nouns; instead of flagging the gender terms in a text, we could reverse them; instad of generating word frequency lists, we can alter the typography by order of frequency" (Ramsay, 2003; pp.171-172)
Writing habits
Does writing change with text visualization? As Lancashire (personal communication, 2004) argued, when criticizing texts, we should pay attention to the tools we use to create the texts as well. Yet, so far, not much is happening on visual writing. Perhaps we need to wait for readership to change first. Then again, online visual chat environments like ChatCircles (Viégas and Donath, 1999) might in fact reflect a double change in visualized writing and the writing on the Internet.
Conclusion
While the text visualization field is only ten years old, it has already produced impressive feats that go far beyond the concordances of the thirteenth century. Literary critics may continue to debate the value of text analysis and visualization, but they are missing what is possible and what is already happening in other fields. Focusing excessively on traditional methods of inquiry will not be sustainable as the fundamental structure of our media and media environments change with digital technology. Rather, it seems more valuable to explore what is possible and what new meanings might emerge from these forms of inquiry that were unavailable to our predecessors eight centuries ago.
See also
- http://www.pnl.gov/infoviz/ has done a lot of wonderful work.
References (annotated)
- NOTE: For another excellent list, please see Nowviskie, B. (2002). Select resources for image-based humanities computing. Computers and the Humanities, 36, 109-131.
Barlow, M. (n.d.). Understanding texts through visualisation. Retrieved from http://www.ruf.rice.edu/~barlow/csc.htm.
- Barlow's proposal for funding. Just an overview of how text visualization works.
Bernstein, M., Bolter, J. D., Joyce, M., Mylonas, E. (1991). Architectures for volatile hypertext. In Proceedings of the third annual ACM conference on Hypertext, San Antonio, Texas, 243-260.
- Using a simple adjacency matrix of the links between nodes in the hypertext, one can visualize clusters. Raising the matrix to higher powers shows regions.
Bradley, J. and Rockwell, G. (1994). What scientific visualization teaches us about text analysis. ALLC/ACH Conference, Paris, 1994. Retrieved from http://www.humanities.mcmaster.ca/~grockwel/ictpaper/paris.htm
- Excellent survey of TextVisualization and why it is important.
Bradley, J., Rockwell, G., (1996). Watching scepticism: Computer assisted visualization and Hume's Dialogues. Research in Humanities Computing 5, Oxford: Clarendon Press, 32-47.
- One of the earliest, if not earliest, figurative representation of a text. Summarized in part [here] They discovered through correspondance analysis of the word forms of scepticism patterns in the text of David Hume's dialogues. The diagram below shows nicely how the word is front and bottom loaded, and in the middle of the work it appears mostly only in the summation at the end of the sections. This discovery propelled them to study TextVisualization more.
Coyne, B. and Sproat, R. (2001). WordsEye: An automatic text-to-scene conversion system. In Proceedings of the 28th annual conference on Computer graphics and interactive techniques, 487-496. Available from www.research.att.com/~rws/wordseye/wordseye-paper.pdf.
- A completely amazing project that translates (complex) English paragraphs into 3D visualizations.
Dodge, M. (2000). NewsMaps?: Topographic mapping of information. Mappa Mundi. Retrieved April 27, 2004 from http://mappa.mundi.net/maps/maps_015.
- A web summary of published papers on how one can use topological maps to understand trends in news.
Gladwin, L. A. () ?The Library of Congress at a glance?: Text visualization and reference rooms without walls.
- Cluster-based topolography mapping of the Library of Congress catalog using TEXTVIZ.
Havre, S., Hetzler, E., Whitney, P., and Nowell, L. (2002). ThemeRiver: Visualizing thematic changes in large document collections. IEEE Transactions on Visualization and Computer Graphics, 8(1), 9-20. Available from http://www.pnl.gov/infoviz/ThemeRiverIEEE2002.pdf.
Hornbæk, K. and Frøkjær, E. (2003). Reading patterns and usability in visualizations of electronic documents. ACM Transactions on Computer-Human Interaction, 10(2), 119-149.
Huang, S., Ward, M. O., Rundensteiner, E. A. (2003). Exploration of dimensionality reduction for text visualization. Technical Report TR-03-14, Worcester Polytechnic Institute, Computer Science Department. Available from http://citeseer.ist.psu.edu/huang03exploration.html
- cf. DimensionReduction.
Kochumman, R., Monroy, C., Furuta, R., Goenka, A., Urbina, E., and Melgoza, E. (2002). Towards an electronic variorium edition of Cervantes' Don Quixote: Visualizations that support preparation. In Proceedings of JCDL '02, Portland, Oregon, July 13-17, 199-200.
- Visualizing differences in versions against the base can help improve the attempt to form an compendium of what constitutes the authoritative text.
Lin, X. (1997) Map displays for information retrieval. Journal of the American Society of Information Science, 48(1), 40-57.
Liu, H., Selker, T., and Lieberman, H. (2003). Visualizing the affective structure of a text document. In Proceedings of CHI '03, Ft. Lauderdale, Florida, April 5-10, 2003, 740-741. Available from http://web.media.mit.edu/~lieber/Publications/Visualizing-Affective.pdf
- Using the Open Mind Commonsense corpus of 400 000 facts about the affective quality of things, their tool automatically colours text on a sentence-by-sentence level into the six basic Ekman emotional categories, one colour per emotion. Then a Bayesian model (to smooth out the dependencies of one Ekman emotion following another; e.g. angry more likely follows sad), the layout structure of the text, and discourse cues generalize the affective quality of the text to successively larger structures. Amazing!
Miller, N. E., Wong, P. C., Brewster, M., and Foote, H. (1998). Topic Islands: A wavelet-based text visualization system. In IEEE Visualization: Proceedings of the conference on Visualization '98., Research Triangle Park, North Carolina, 189-196. Available from http://www.pnl.gov/infoviz/vis98paper.pdf
- Most topical analysis tools attempt to situate documents with respect to each other in some topographical map. Readers however are given little aid to navigate large documents themselves. Topic Islands is a very beautiful visualization that finds themes within a document based a novel form of correspondance analysis between successive sentences. Multiple representations and interfaces to the documents are ultimately rendered. The accuracy of the analysis is stunning, although it does require human intervention to select likely topic shifts from the wavelet analysis (although from the data presented, this didn't seem necessary).
Ramsay, S. (2003). Reconceiving text analysis: Toward an algorithmic criticism. Literary and Linguistic Computing, 18(2), 167-174.
- Text analysis is a more empirical form of literary criticism than merely impressionistic criticism. Current practice is at most to only use statistical data when testing hypotheses, as statistical models are still very untrusted; often for good reason as statistics do not yet give rise to meaning. Ramsay continues by suggesting that we might go beyond statistics, and actually use the algorithms to alter (or rather tamper) the text in a playful quest for new patterns. "Instead of concording nouns in a text, we might create machines that cleave off all words except the nouns; instead of flagging the gender terms in a text, we could reverse them; instad of generating word frequency lists, we can alter the typography by order of frequency" (pp.171-172)
Rockwell, G., Bradley, J., Monger, P. (1998) Seeing the text through the trees: Data and program visualization in the humanities. In Proceedings of ALLC/ACH '98. Notes available from http://lingua.arts.klte.hu/allcach98/abst/abs42.htm
- Uses implicit surface models to visualize word frequencies and cross-document concordances in Shakespeare as amorphous 3D "blobs". Not very interesting.
Rockwell, G. (2003). What is text analysis, really? Literary and Linguistic Computing, 18(2), 209-219
- Provides an excellent history of text analysis. Suggests that new texts generated by computers are interpretations (or interpretative aids, if you prefer), which are analytic in nature. Suggests they should be taken seriously by literary critics. And finally makes a call for the portal model, such as TAPoR?.
Rohrer, R. M., Ebert, D. S., and Sibert, J. L. (1998) The shape of Shakespeare: Visualizing text using implicit surfaces. In Proceedings of the IEEE Symposium on Information Visualization '98, October 19 - 20, 1998, North Carolina, 121-128.
Sinclair, S. (2003) Computer-assisted reading: Reconceiving text analysis. Literary and Linguistic Computing, 18(2), 175-184.
- Text analysis portrayed as giving scientific value to literary criticism is rarely accepted; rather, often paradoxically, the more vague the conclusion in literary criticism, the more interesting it is. Therefore, we should rather pitch text analysis as new ways to experience the text through computer-assisted reading, text synthesis, and play.
Small, D. (1996). Navigating large bodies of text. IBM Systems Journal, 35(3&4), 514-525. Available from http://www.research.ibm.com/journal/sj/mit/sectiond/small.pdf
- The Visual Shakespeare project provides ZoomableViews onto the million line Shakespeare corpus rendered in 3D. The focus is mostly on typographic issues.
Wise, J. A., Thomas, J. J., Pennock, K., Lantrip, D., Pottier, M., Schur, A., and Crow, V. (1995) Visualizing the non-visual: Spatial analysis and interaction with information from text documents. In Proceedings of the IEEE Information Visualization Symposium '95, Atlanta, Georgia, October, 1995, 51-58. Available from http://www.cs.duke.edu/courses/spring03/cps296.8/papers/vis_non_visual.pdf
- Distills and codifies what processes and architecture is necessary for statistical theme-detection and its respective text visualization. Uses the GalaxyVisualization? and ThemeSpace? as examples.
Wise, J. A. (1999). The ecological approach to text visualization. Journal of the American Society for Information Science, 50(13), 1224-1233.
- The Galaxy and the ThemeScape? TextVisualizations required fundamental changes in how the underlying TextAnalysis? was carried out. Previous forms of text analysis were heavily weighted towards information retrieval purposes. The authors argue that needs should be driven from the perculariaties of HumanVision down through the layers of code, ultimately requiring new statistics. Text visualization is not merley an illustration, but rather a spatialization.
Wong, P. C., Whitney, P., Thomas, J. (1999). Visualizing association rules for text mining. Available online from http://www.pnl.gov/infoviz/InfoVis1999Association.pdf.
- Visualizing text correspondences ArchivingNews through analysis of sequences of keywords through the corpus. Novel visualization of multiple antecedents to one consequent using a new 2D matrix display.
Additional references
Aarseth, E. J. (1997). Cybertext: Perspectives on ergodic literature. Baltimore, Maryland: John Hopkins University Press.
Gale, M. (1997). Dadaism and surrealism. London: Phaidon Press.
Kohonen, T. (1989). Self-organization and associate memory (3rd ed.) Berlin: Springer-Verlag.
Mathews, H. and Brotchie, A. (1998). Oulipo compendium. London: Atlas.
Miller, W. M. (1959). A canticle for Leibowitz. Philadelpha: Lippincott.
Ong, W. (1982) Orality and literacy. The Technologizing of the word. London: Routledge. As summarized by D. Reinking at http://www.coe.uga.edu/reading/faculty/dreinking/ONG.html
Raskin, J. (2000). The humane interface: New directions for designing interactive systems. New York: John Wiley & Sons.
Schement, J and Curtis, T. (1995). Tendencies and Tensions of the Information Age. New Brunswick: Transaction Publishers.
Viégas, F. and Donath, J. (1999) Chat Circles. in Proceedings of CHI 99 Conference on Human Factors in Computing Systems, 15-20 May, Pitssburg, USA, 9-16. Available from http://www.media.mit.edu/~fviegas/chat-circles_CHI.html
Ware, C. (2000). Information visualization: Perception for design. London, UK: Academic Press.
Images

- Figure 1. Vico's allegorical representation of The New Science. (From http://www3.niu.edu/acad/english/vico/big_vico.jpg)

- Figure 2. An early visualization of concordance. Sceptic in Hume's Dialogues (Bradley and Rockwell, 1996).

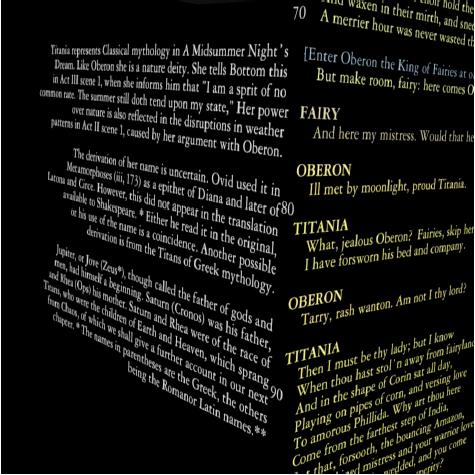
- Figure 3. Tracing a Titania's role through Midsummer's Night Dream (Small, 1996).
- Figure 4. Annotations rotated 90 degrees to the main text to maintain context (Small, 1996).

- Figure 5. ThemeRiver demonstrates themes in Fidel Castro's speeches from 1959-mid 1961 (Havre, Hetzler, Whitney, and Nowell, 2002).

- Figure 6. Topic Islands detects and separates theme shifts within an article on a violent crackdown on Buddhists in South Vietnam (Miller, Wong, Brewster, and Foote, 1998). The overlayed arrows show the clean path of the article (start to finish) across the well placed "islands."

- Figure 7. WordsEye automatically renders an English description of a scene as a figurative 3D model (Coyne and Sproat, 2001). This scene describes the text:
- John uses the crossbow. He rides the horse by the store. The store is under the large willow. The small allosaurus is in front of the horse. The dinosaur faces John. A gigantic teacup is in front of the store. The dinosaur is in front of the horse. The gigantic mushroom is in the teacup. The castle is to the right of the store.