![[Home]](http://meatballwiki.org/meatball.gif) StableCopyEmpiricalResults
StableCopyEmpiricalResults
MeatballWiki | RecentChanges | Random Page | Indices | CategoriesThe StableCopy of a page is the last revision that survived a fixed PeerReview period. On MeatBall, that period is two weeks. So how many edits are involved, on average, in PeerReview? How many times does the author change (edit chains) before the page is left to cool?
Having analyzed 500 days of MB edits, these variables both appear to have a WikiPedia:Log-normal_distribution: most PeerReview periods involve very few edits, but there are some rare occasions when everyone wants to have a say, or two people get into a heated discussion.
Some good take-home statistics:
- Fewer than 10% of PeerReview periods have more than 4 edit chains, or more than 8 edits.
- More than 60% of edits are accepted without comment by our PeerReviewers.
- More than 80% interest no more than one PeerReviewer to edit, with no subsequent rejoinder by the original editor.
- Over the analyzed period of 500 days, 6 of the 3685 unstable periods had more than 50 edit chains, and 6 had more than 150 edits.
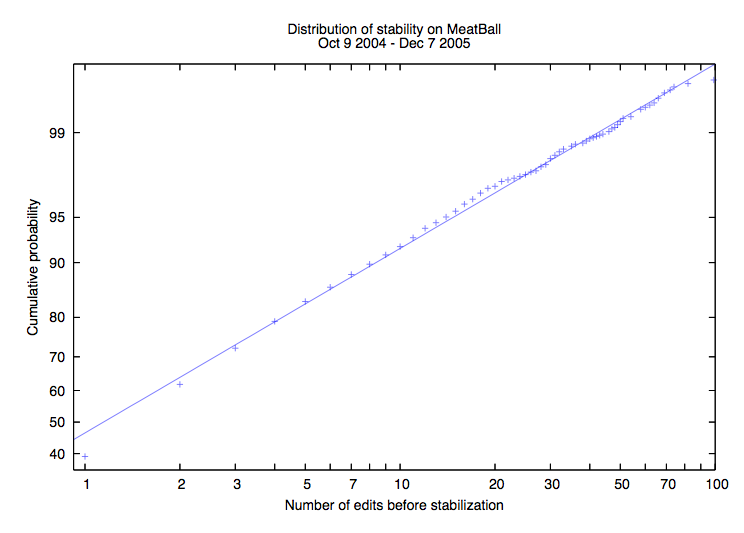
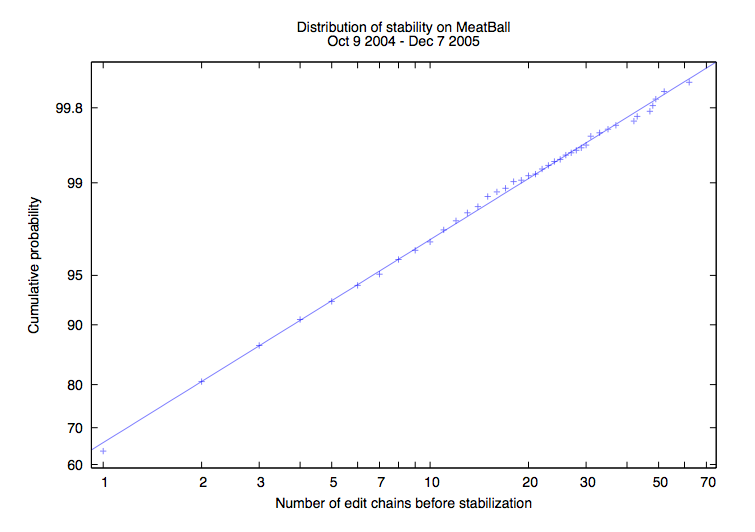
The graphs shown plot the logarithm of the number of (edits/edit chains) against inverse-normal of the cumulative probability; a best-fit straight line demonstrates a reasonable fit with the suggested distribution. In both cases, the SandBox is a wild extremity, not shown on the graph to avoid squashing the other points into a corner. -- ChrisPurcell
- The axis cumulative probability means that X% of the unstable periods had less than or equal to N edits / edit chains.
- This is very interesting. (My effort to push this page up the curve.) I'm curious, what inspired the stroke of genius to choose cumulative probability? -- SunirShah
I can't remember where I found the idea, but I've been doing this kind of thing for a couple of years now. Try googling for "fitting normal distributions with gnuplot" or something, and you'll probably find the very page I used. -- ChrisPurcell
After discovering the excellent RLanguage recently, I've returned to the kind of distribution shown above. As you may have spotted, the distribution, cannot actually be log-normal (though it has a similar cumulative distribution shape) because it takes discrete values. A better distribution appears to be the lesser-known Poisson lognormal (or Discrete lognormal).
When I say lesser-known, I mean it; there is not even a WikiPedia page. Some interesting material can be found, e.g. in [Colwell] and Coddington 1994 p. 108, or [Software defect rediscoveries: a discrete lognormal model]. There is also a [poilog package for R], which gives graphs looking very like those above. However, I am loathe to claim the curve above is a discrete lognormal without further investigation. One unfortunate issue holding me back is that I have lost the data I used originally. -- ChrisPurcell